
Whatever your education level or goal, there are lots of occupations to consider. The charts below focus on two education levels, high school diploma or the equivalent and bachelor’s degree. Each education level highlights selected occupations expected to have many annual average openings for new entrants from 2022 to 2032. Home health and personal care aides stands out among the occupations in these charts as having the largest number of projected openings, averaging well over half a million each year.
Most openings come from the need to replace workers who leave permanently, either to exit the labor force or to transfer to a different occupation. But others are from employment growth—that is, newly created jobs. Hover over a bar in the charts below to see an occupation’s wage, which you can compare with the $46,310 median annual wage for all occupations, as well as the work experience typically needed for entry and the training typically required to become competent.
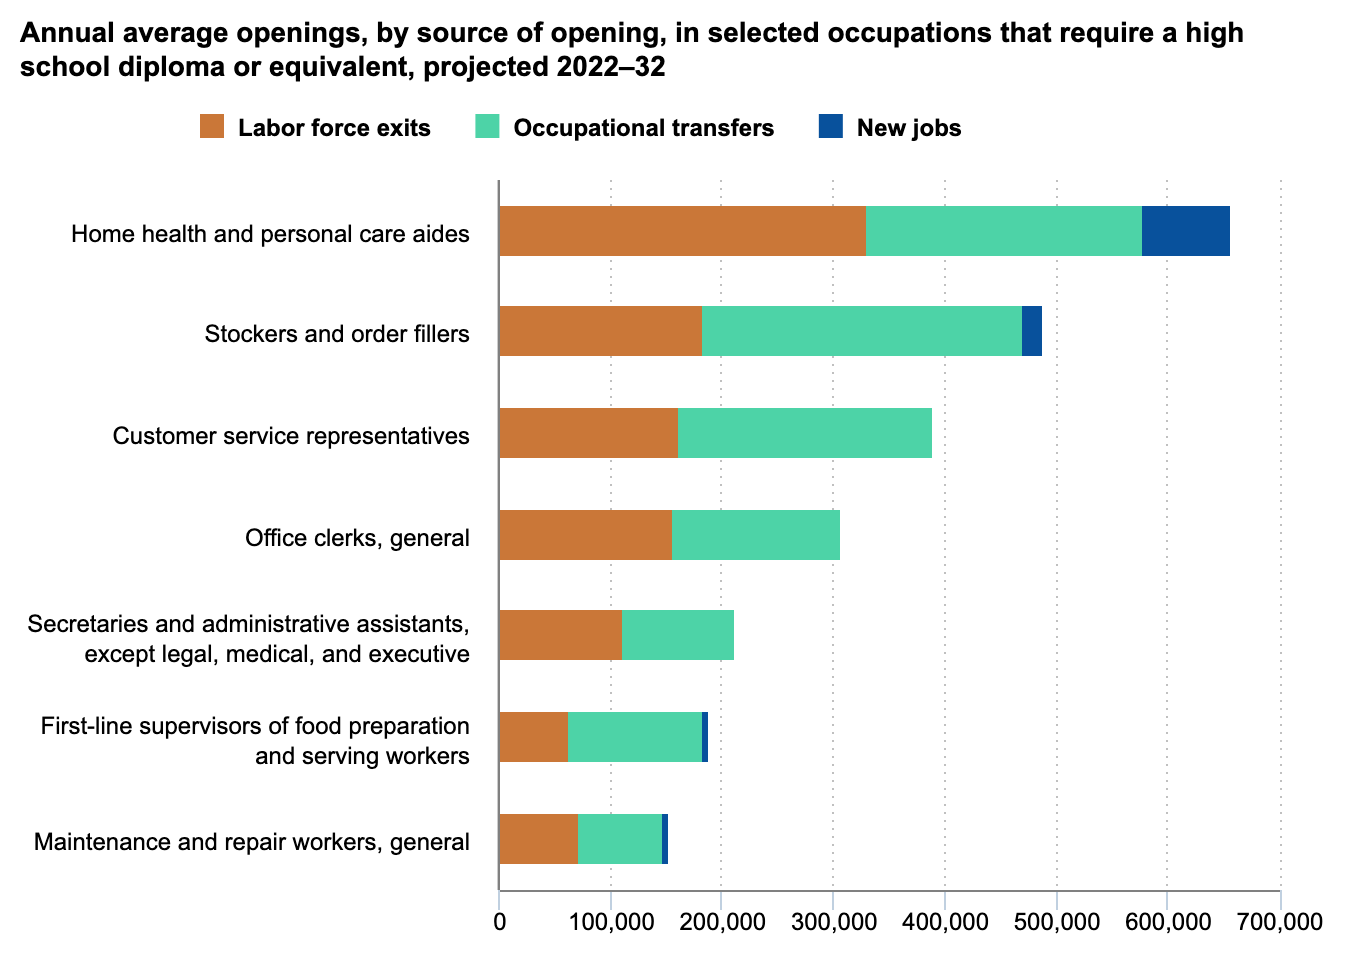
Chart Image: Annual average openings, by source of opening, in selected occupations that require a high school diploma or equivalent, projected 2022–32
Source: U.S. Bureau of Labor Statistics
Chart Data: Annual average openings, by source of opening, in selected occupations that require a high school diploma or equivalent, projected 2022–32
| Occupation | New jobs | Occupational Transfers | Labor Force Exits | Median Annual Wage, 2022 | Work experience in a related occupation typically required for entry | On-the-job training typically required to attain competency |
|---|---|---|---|---|---|---|
| Home health and personal care aides | 80,500 | 247,700 | 329,400 | 30,180 | None | Short-term |
| Stockers and order fillers | 17,900 | 287,900 | 182,900 | 34,220 | None | Short-term |
| Customer service representatives | 0 | 227,500 | 162,200 | 37,780 | None | Short-term |
| Office clerks, general | 0 | 151,700 | 155,900 | 38,040 | None | Short-term |
| Secretaries and administrative assistants, except legal, medical, and executive | 0 | 100,600 | 111,300 | 41,000 | None | Short-term |
| First-line supervisors of food preparation and serving workers | 6,000 | 119,900 | 63,000 | 37,050 | Less than 5 years | None |
| Maintenance and repair workers, general | 5,700 | 74,700 | 72,100 | 44,980 | None | Moderate-term |
| Source: U.S. Bureau of Labor Statistics | ||||||
Occupations that typically require a high school diploma or the equivalent for entry have the most projected openings of any education level: 7.1 million per year, on average, over the decade. And the occupations shown accounted for about one-third of those total openings.
The home health and personal care aides occupation is projected to have more openings due to new jobs compared with any other occupation in the economy, as these workers are increasingly needed to help care for an aging population. The highest-paying of the selected high-school level occupations was general maintenance and repair workers, with a median annual wage of $44,980. The lowest paying in the chart was home health and personal care aides, with a median annual wage of $30,180.
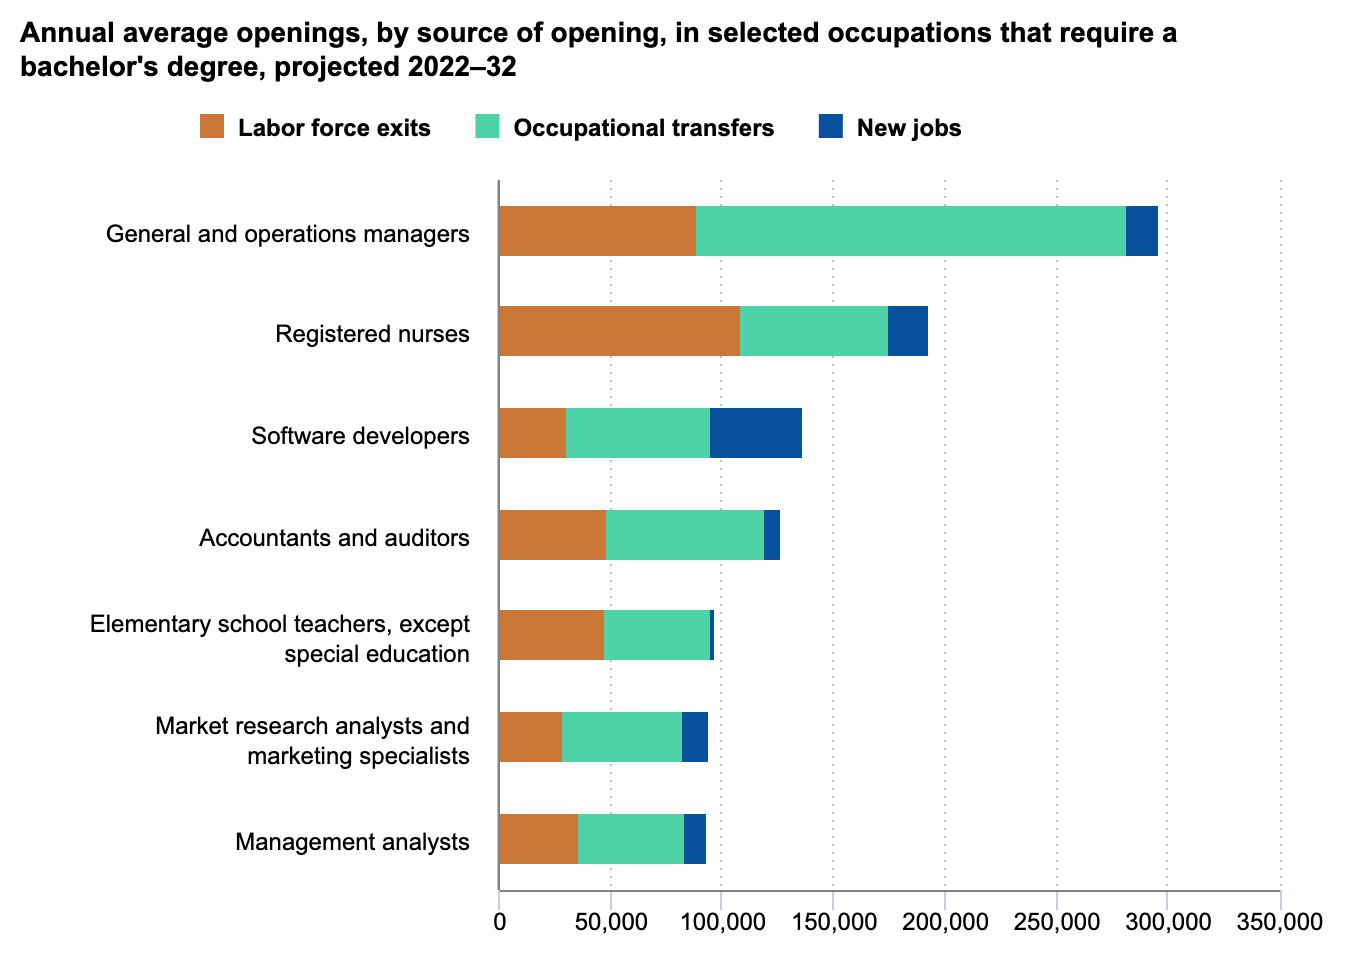
Chart Image: Annual average openings, by source of opening, in selected occupations that require a bachelor's degree, projected 2022–32
Source: U.S. Bureau of Labor Statistics
Chart Data: Annual average openings, by source of opening, in selected occupations that require a bachelor's degree, projected 2022–32
| Occupation | New jobs | Occupational Transfers | Labor Force Exits | Median Annual Wage, 2022 | Typical work experience in a related occupation | On-the-job training typically required to attain competency |
|---|---|---|---|---|---|---|
| General and operations managers | 14,700 | 192,400 | 89,200 | $98,100 | Less than 5 years | None |
| Registered nurses | 17,700 | 67,100 | 108,300 | 81,220 | None | None |
| Software developers | 41,000 | 64,400 | 30,900 | 127,260 | None | None |
| Accountants and auditors | 6,700 | 71,200 | 48,500 | 78,000 | None | None |
| Elementary school teachers, except special education | 1,000 | 47,000 | 48,000 | 61,690 | None | None |
| Market research analysts and marketing specialists | 11,700 | 53,900 | 29,000 | 68,230 | None | None |
| Management analysts | 9,600 | 47,700 | 35,600 | 95,290 | Less than 5 years | None |
| Source: U.S. Bureau of Labor Statistics | ||||||
Occupations that typically require a bachelor’s degree are expected to have 3.3 million openings each year, on average, over the projections decade. Overall, employment in bachelor’s-level occupations is projected to grow faster than the average for all occupations. This growth reflects the relatively high numbers of openings due to new jobs.
Of the selected bachelor’s-level occupations, software developers are expected to have the largest number of openings from growth (41,000 each year, on average), and it had the highest median annual wage ($127,260). Elementary school teachers, except special education, had the lowest wage ($61,690) of the selected occupations.
To learn more, see "Education level and projected openings, 2022–32", Career Outlook, January 2024. The charts in this article highlight a fraction of the more than 800 occupations for which BLS makes employment projections. Search for occupations by education level, wages, and other variables using the “Select occupations by” feature of the Occupational Outlook Handbook (OOH).
Article Courtesy: US Bureau of Labor and Statistics