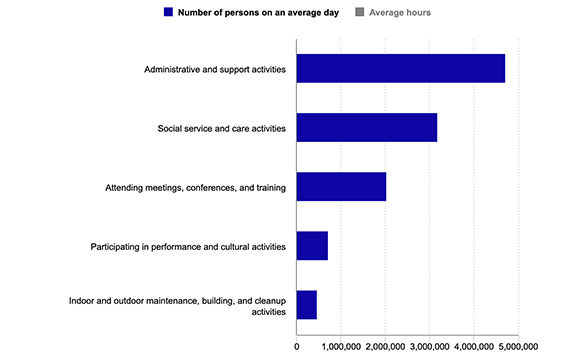
Number of persons and average hours per day for participants in volunteer activities, 2022
National Volunteer Month, celebrated in April, honors the nation’s volunteers and encourages people to get out and lend a hand. On an average day in 2022, more than 11 million people volunteered in some manner. Of these, approximately 7 million were women and 4 million were men.
Chart Data: Number of persons and average hours per day for participants in volunteer activities, 2022
| Activity | Number of persons on an average day | Average hours | ||||
|---|---|---|---|---|---|---|
| Administrative and support activities | 4,712,000 | 1.56 | ||||
| Social service and care activities | 3,187,000 | 2.23 | ||||
| Attending meetings, conferences, and training | 2,038,000 | 2.15 | ||||
| Participating in performance and cultural activities | 721,000 | 2.40 | ||||
| Indoor and outdoor maintenance, building, and cleanup activities | 470,000 | 2.07 | ||||
| Source: U.S. Bureau of Labor Statistics | ||||||
On an average day in 2022, around 4.7 million people volunteered in administrative and support activities, which includes computer use and fundraising, spending an average of 1.56 hours a day in those activities. About 3.2 million people volunteered in social service and care activities, typically spending around 2.23 hours a day on average in those activities. These volunteers provided services such as preparing food, collecting clothing and goods, visiting with others, teaching, mentoring, and sewing.
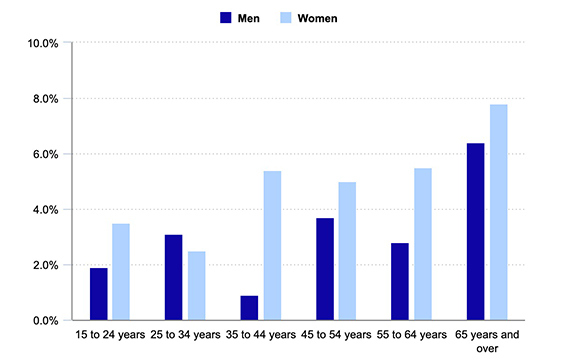
Volunteer rates tended to increase with age, and women tended to volunteer more than men. For those 15 years and older, 5.1 percent of women volunteered on an average day, compared with 3.2 percent of men. Among age groups, the highest rates of volunteering were for those 65 years and older, with 7.8 percent of women and 6.4 percent of men volunteering on an average day.
Chart Image: Percentage of the population who volunteered on an average day, by age and sex, 2022
Source: U.S. Bureau of Labor Statistics
Chart Data: Percentage of the population who volunteered on an average day, by age and sex, 2022
| Age | Men | Women | ||||
|---|---|---|---|---|---|---|
| 15 to 24 years | 1.9 | 3.5 | ||||
| 25 to 34 years | 3.1 | 2.5 | ||||
| 35 to 44 years | 0.9 | 5.4 | ||||
| 45 to 54 years | 3.7 | 5.0 | ||||
| 55 to 64 years | 2.8 | 5.5 | ||||
| 65 years and over | 6.4 | 7.8 | ||||
| Source: U.S. Bureau of Labor Statistics | ||||||
Volunteer rates declined from 2012 (5.8 percent) to 2022 (4.2 percent). Rates fell for both men and women over the decade, though the volunteer rate for women increased in the most recent period, from 4.1 percent in 2021 to 5.1 percent in 2022.
These data are from the American Time Use Survey. For more information, see “American Time Use Survey — 2022 Results.” We also have more charts on American Time Use Survey data.
Article Courtesy: US Bureau of Labor and Statistics